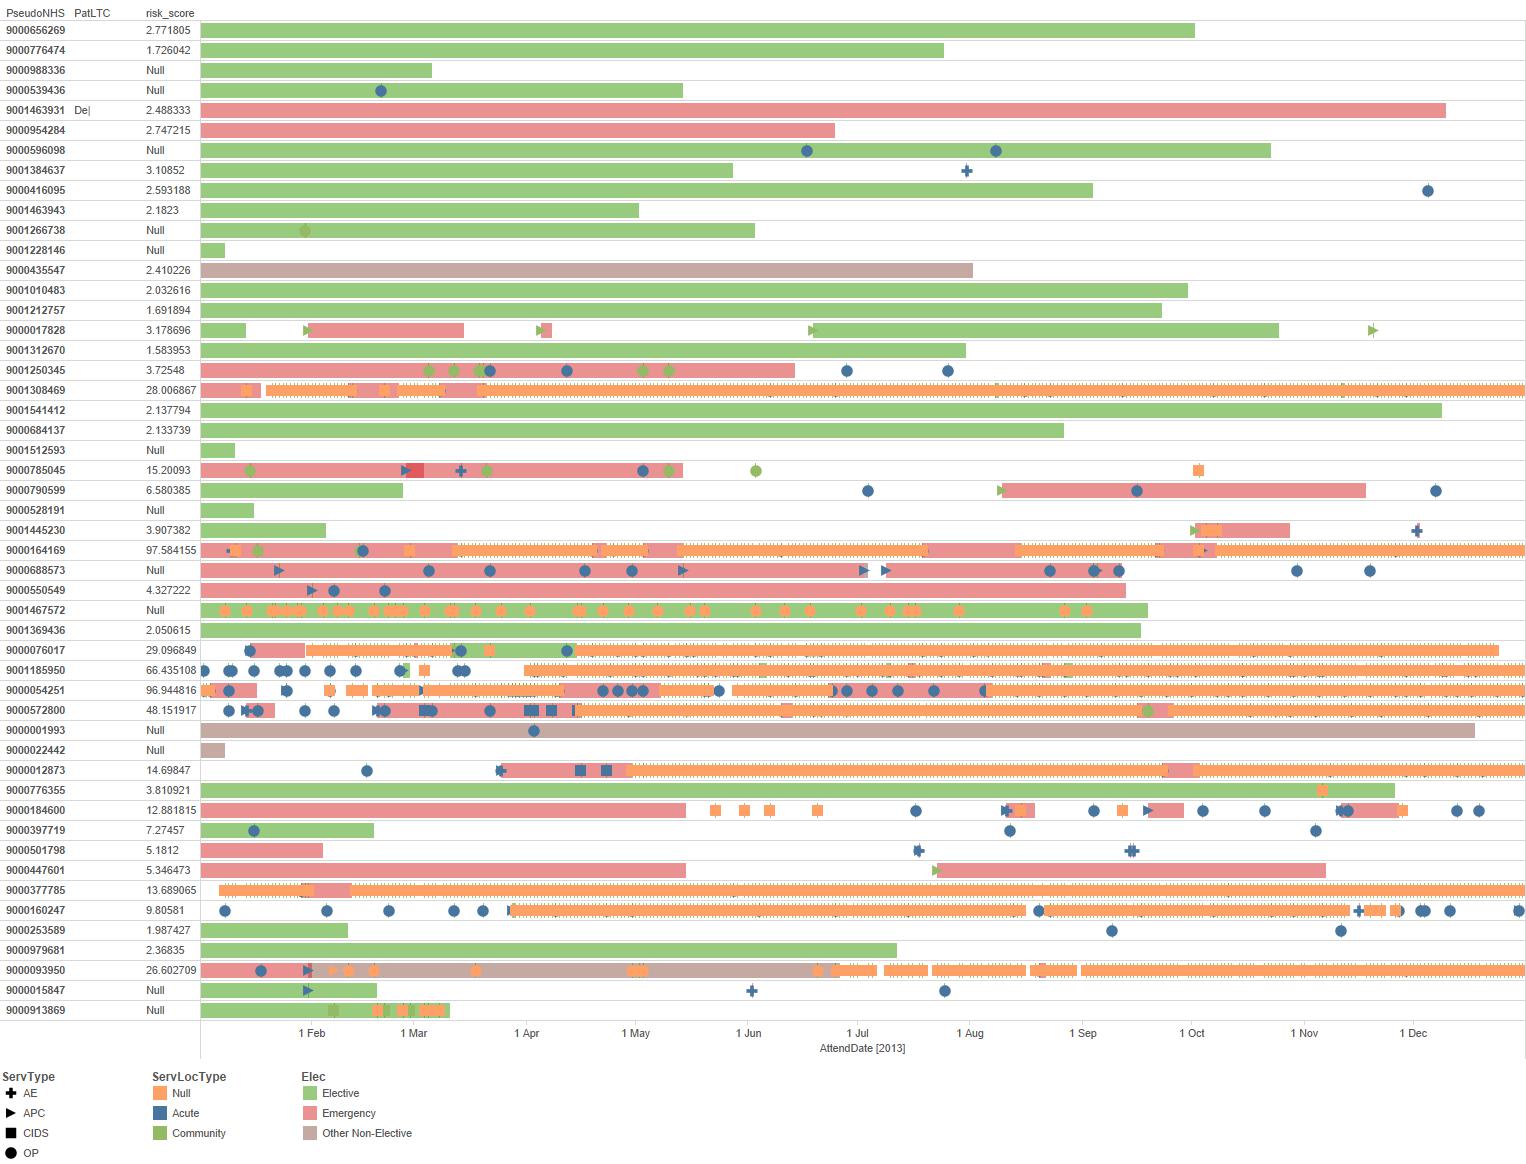
This chart shows the activity for each patient (with a PseudoNHS number) within A&E, APC, OP and CIDS between 01/01/2013 and 31/12/2013. Each patient is represented by a separate row. The chart is limited to the top 50 patients in terms of activity. Note: Some of the activity may have been for a previous time period but ended within this time period.)
The shape of the symbol represents the type of service visited by the patient (cross = A&E, arrow = APC, square = CIDS, circle = OP) and the colour of the symbol, whether it was in an acute (blue) or community (green) setting (orange is unallocated).
The bars represent a patient stay in hospital and the colour of the bar whether it was and elective (green), emergency (red) or other non-elective (brown) stay.
 Chris M is the founder and managing director of Mayden. He has 21 years of experience in the healthcare industry, where he worked as a hospital manager and later as a management consultant specialising in information analysis and modelling.
 Chris E is Mayden‘s director of operations and has been with the company since 2009. He has a background in mechanical engineering, and studied at postgraduate level at Cambridge University.
 Coralie has a first class bachelors degree in cybernetics and control engineering as well as a masters degree in biomedical engineering. She has ten years’ experience in IT and software development.
 Juliette is our in-house Tableau specialist. She has 20 years experience in health analytics, and has worked for NHS Trusts, a leading health management consultancy as a freelance analyst.
 Alison is a director at Mayden and oversees organisational development, business development and marketing. Having started her working life as a graduate General Management Trainee in the NHS, she went on to hold a number of operational and strategic management positions in acute and community sectors before moving into management consultancy with one of the UK’s leading specialist healthcare consultancy firms.