For decades now, the report has been the standard output of most analysis projects. Invariably, the work has been done in Excel or Access – maybe even SPSS for the more statistically minded – but clients have never been particularly receptive to taking responsibility for an Excel model or a database. What they want is a report. Lots of words. The occasional graph.
So we create databases and build spreadsheet models, making them ever more versatile and flexible, able to run umpteen thousand different scenarios and variations. And then we select the one or two that matter, that make our case, for the “report”, usually a document written in Word with Excel charts embedded. The only thing that has really changed with this process in decades is that reports now tend to be PDF documents and the more user friendly reports are produced in Powerpoint.
And this is all fine, until you want to ask the “What if…?” question. Suddenly, the trustworthy PDF document, purposely designed to be fixed and unalterable, able to transform into perfect paper copies on any printer, proves to be frustratingly unyielding.
“Yes I like that bar chart but I’m sure it would be quite different for males and females. How do I check that?”
“Yes the pie chart is useful but I really need to omit the ‘Other’ slice for it to emphasise the point I’m trying to make.”
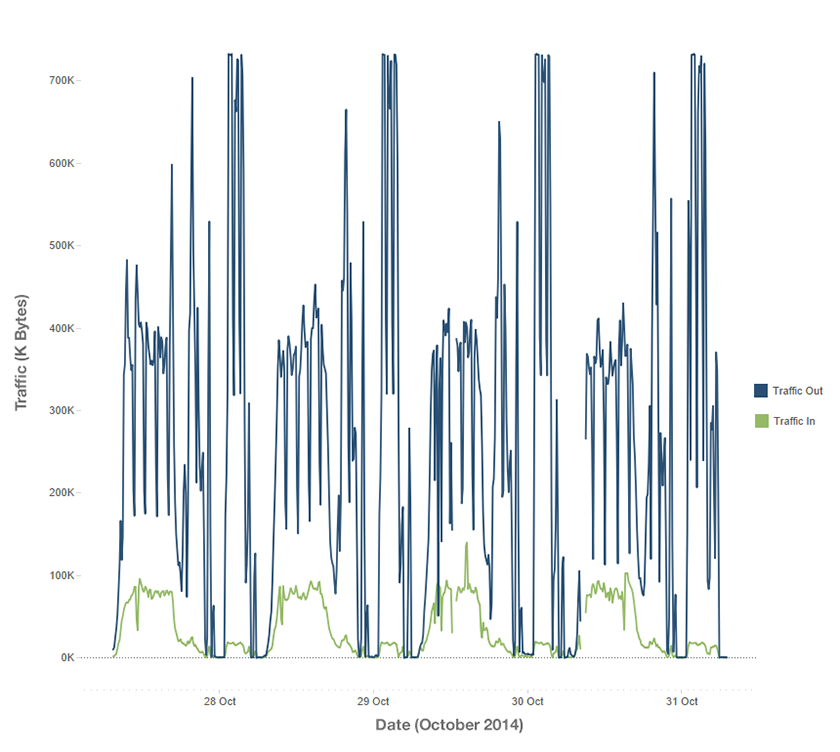
“Yes the time series does show an increasing annual trend but I’m sure if you looked at it using a different timeline there would be large fluctuations.”
For the last few years we have been encouraging clients to accept dashboards as the preferred output of our analytics work rather than reports. They can be designed and configured to project our key messages while allowing clients to play with the variables and answer those “What if…?” questions for themselves. Gone are all the words. Instead, simple statements backed up by high quality graphics help us get our message across far more effectively.
Tableau, our preferred analytics platform, also now has a storyboard feature that effectively allows us to create presentations – stories – from the dashboards we produce so we can lead our clients through the data in a systematic way. Yet they can also deviate from the path we have chosen for them to follow and dive into the data themselves. The best of both worlds.
So hopefully, soon, the report will be a thing of the past, replaced by a single email with a hyperlink to a whole new world of presenting data analytics. Bring it on!
 Chris M is the founder and managing director of Mayden. He has 21 years of experience in the healthcare industry, where he worked as a hospital manager and later as a management consultant specialising in information analysis and modelling.
 Chris E is Mayden‘s director of operations and has been with the company since 2009. He has a background in mechanical engineering, and studied at postgraduate level at Cambridge University.
 Coralie has a first class bachelors degree in cybernetics and control engineering as well as a masters degree in biomedical engineering. She has ten years’ experience in IT and software development.
 Juliette is our in-house Tableau specialist. She has 20 years experience in health analytics, and has worked for NHS Trusts, a leading health management consultancy as a freelance analyst.
 Alison is a director at Mayden and oversees organisational development, business development and marketing. Having started her working life as a graduate General Management Trainee in the NHS, she went on to hold a number of operational and strategic management positions in acute and community sectors before moving into management consultancy with one of the UK’s leading specialist healthcare consultancy firms.